

Celestia Light Node and Analysis for Novice Users
Celestia Light Node and Analysis for Novice Users
Guide and scripts to install and run an analysis server for Celestia DA Light nodes

In this article I will detail out a simple Celestia Data Availability Light Node set up combined with an analysis stack. This stack is targeted at the less savvy node operator and intends to provide basic metrics to showcase how the node and machine are functioning through a Grafana dashboard.
Hardware Requirements:
1vCPU / 2GB RAM / 25GB SSD / 56 kbps
OS: Ubuntu Linux 20.04 (LTS) x64
Note: this is the minimum recommended requirement to run this stack.
See official guides for Celestia on setting up a Data Availability Node here. This document is designed for an easy step by step setup for beginner users who want to understand the process. I have automated most of the steps in my GitHub where the entire tool is present, it utilises Docker and some scripts to make things much smoother for the end user.
The basic set up is similar to that from the Celestia GitHub:
Celestia Node —> OTEL Collector (deployed as an agent) —> Prometheus <— Grafana
The OTEL collector is using prometheus to scrape the node and transfer back to Prometheus where Grafana can then query the data to visualise.
This stack can be on a separate server, this might be applicable if there are resource constraints (e.g. running a full/light node on a less powerful machine). But in this article I will assume it as ran on the same machine.
Software used:
Celestia Light Node
Docker
Node_Exporter
Otel Collector (deployed as an agent)
Prometheus
Grafana
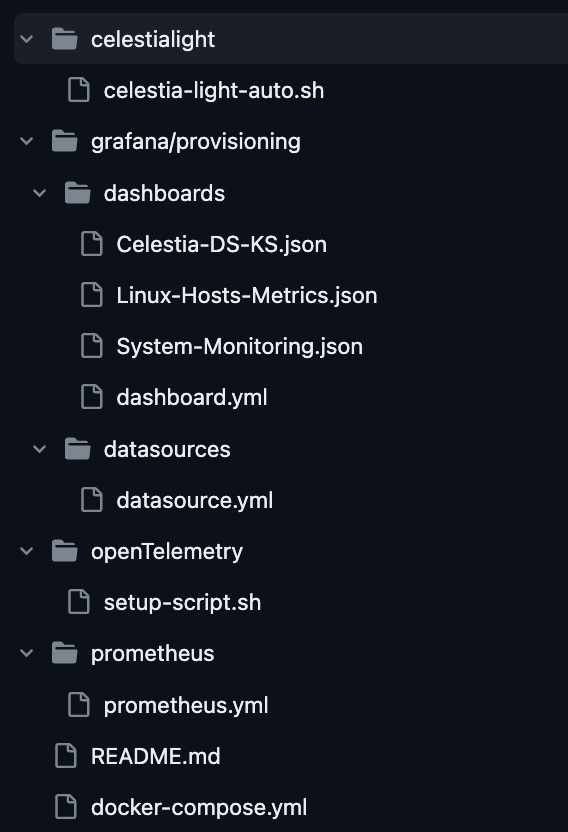
Directory Structure
Setup Docker in Ubuntu
Set up the repository
Update the apt package index and install packages to allow apt to use a repository over HTTPS, add Docker’s official GPG key and set up the repository:
sudo apt-get update && sudo apt-get install ca-certificates curl gnupg -y && sudo install -m 0755 -d /etc/apt/keyrings && curl -fsSL https://download.docker.com/linux/ubuntu/gpg | sudo gpg --dearmor -o /etc/apt/keyrings/docker.gpg && sudo chmod a+r /etc/apt/keyrings/docker.gpg && echo "deb [arch=$(dpkg --print-architecture) signed-by=/etc/apt/keyrings/docker.gpg] https://download.docker.com/linux/ubuntu $(. /etc/os-release && echo $VERSION_CODENAME) stable" | sudo tee /etc/apt/sources.list.d/docker.list > /dev/null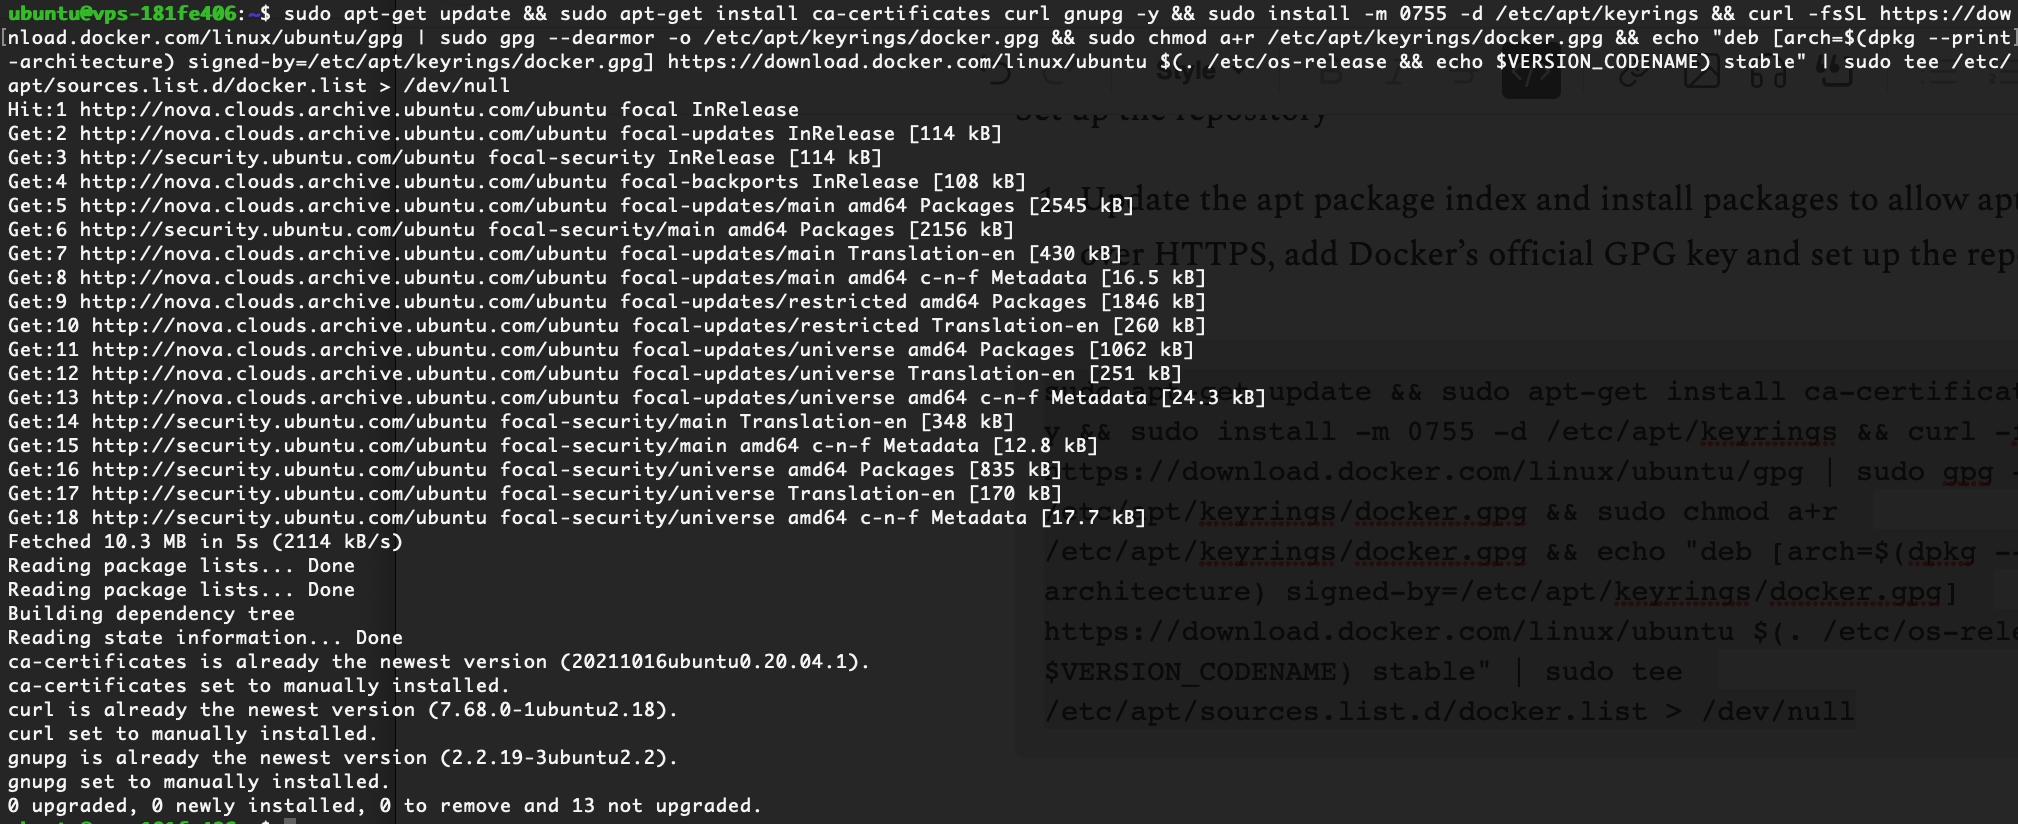
Install Docker Engine in Ubuntu
The below command installs Docker Engine, containerd, Docker Buildx plugin, and Docker Compose.
Downloads and installs Docker Compose binary.
Adds the ubuntu user to the docker group to allow Docker commands without sudo.
sudo apt-get update && sudo apt-get install docker-ce docker-ce-cli containerd.io docker-buildx-plugin docker-compose-plugin -y && sudo curl -L "https://github.com/docker/compose/releases/download/1.29.2/docker-compose-$(uname -s)-$(uname -m)" -o /usr/local/bin/docker-compose && sudo chmod +x /usr/local/bin/docker-compose && sudo usermod -aG docker ubuntu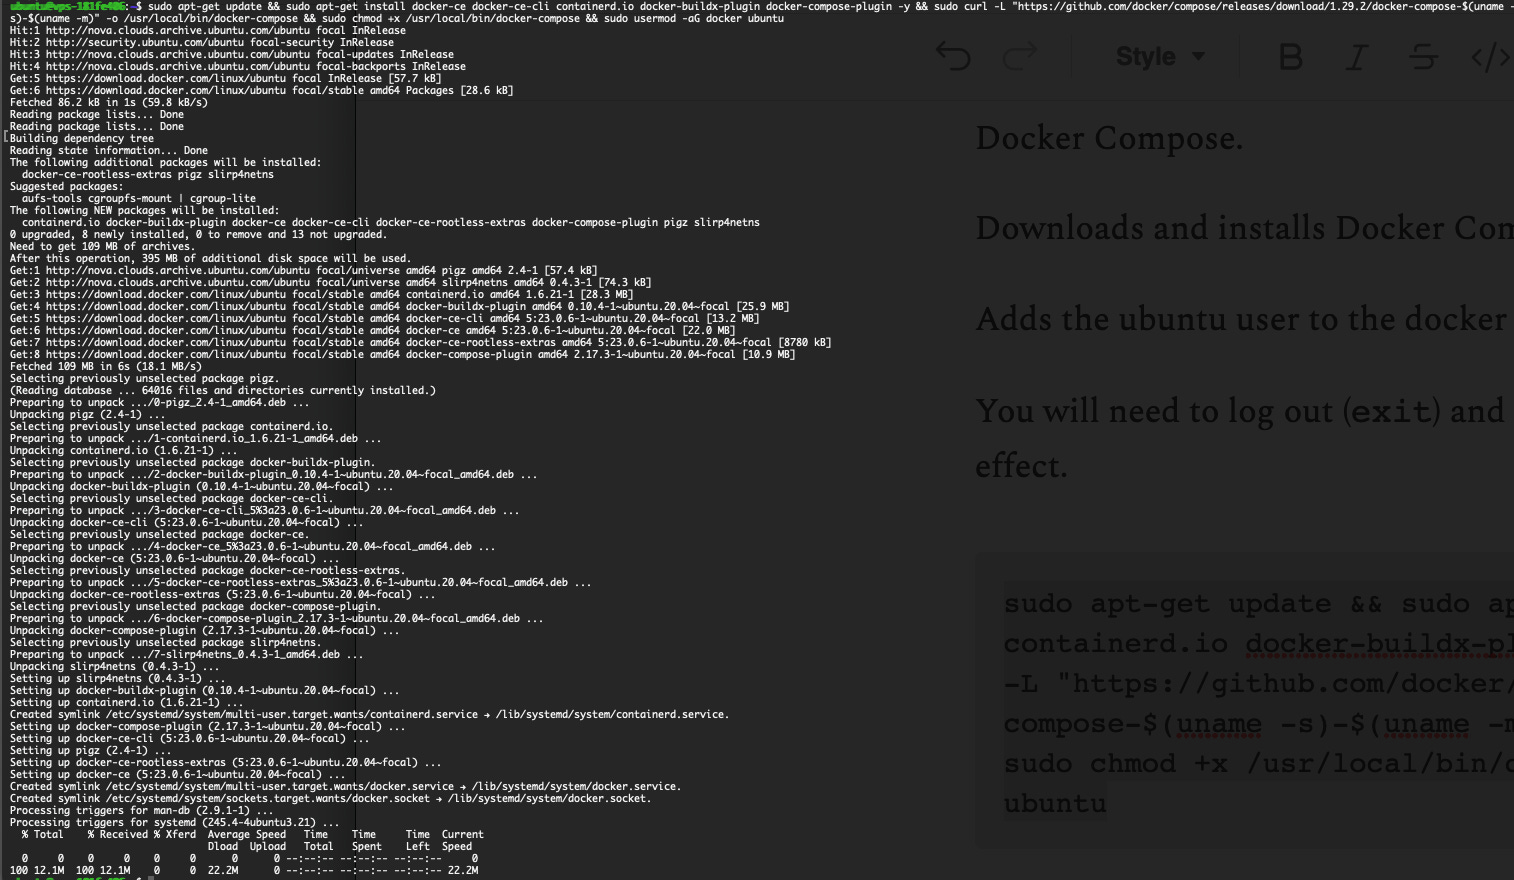
You will need to log out (exit) and log back in for the group membership to take effect.
Setup Celestia Light Node in Ubuntu
Clone the repo:
git clone https://github.com/knightsemplar/celestia_analysis
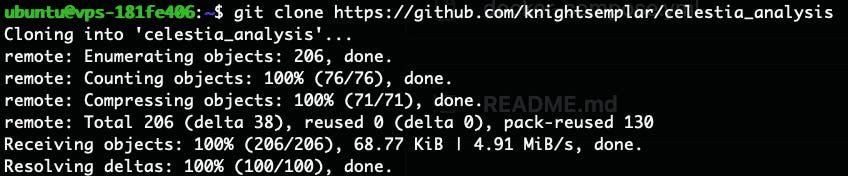
Go inside the celestialight directory, make the script executable and run:
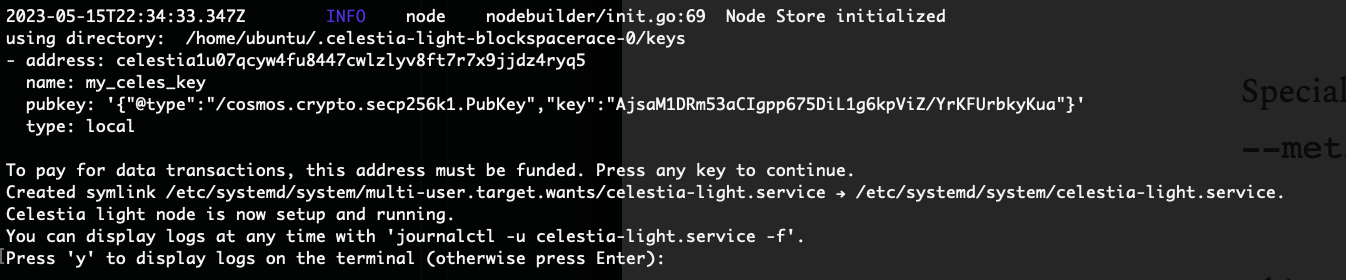
cd celestia_analysis/celestialight && chmod +x celestia-light-auto.sh && ./celestia-light-auto.shThis will automatically set up and run a Celestia Light Node with a new wallet and default settings on the Blockspacerace network, it will also add metrics to allow analysis through Open Telemetry. Be sure to save your passphrase for future reference (search my_celes_key).
For a more customised set up, please refer to the Celestia docs, or the repo in the resources section.
Be aware: this can take a while to download.
If running a custom node, be sure to add these metrics: --metrics --metrics.tls=false --metrics.endpoint 0.0.0.0:4318The above script has them automatically added
This will allow our Otel Collector to collect and export Celestia DA metrics to Prometheus.
Setup OpenTelemetry Collector in Ubuntu
Enter the celestia_analysis/openTelemetry directory, make the script executable and run the script:
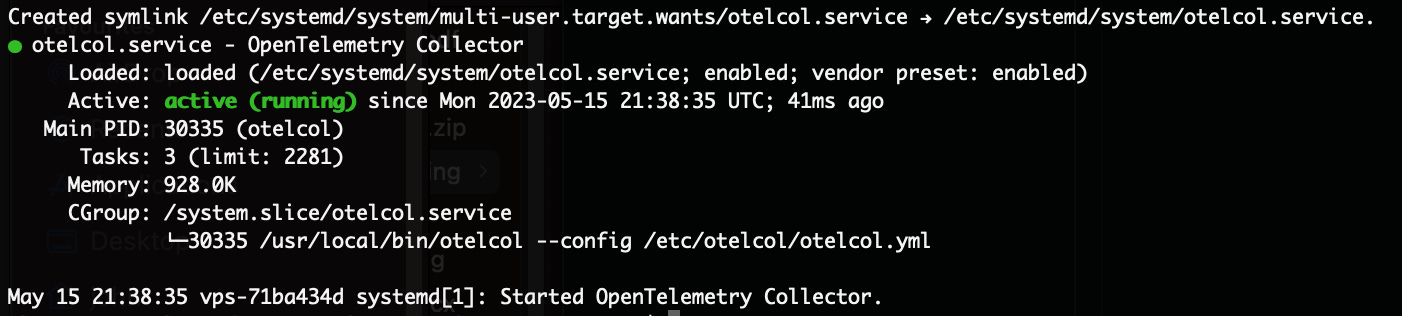
cd && cd celestia_analysis/openTelemetry && chmod +x setup-script.sh && ./setup-script.shA .yml file is created which allows the scrape of the Celestia node (the earlier --metrics tags are essential for this to happen)
When the setup is completed successfully, you will see the output that the service is active and running.
Setup Prometheus, Grafana, and Node Exporter
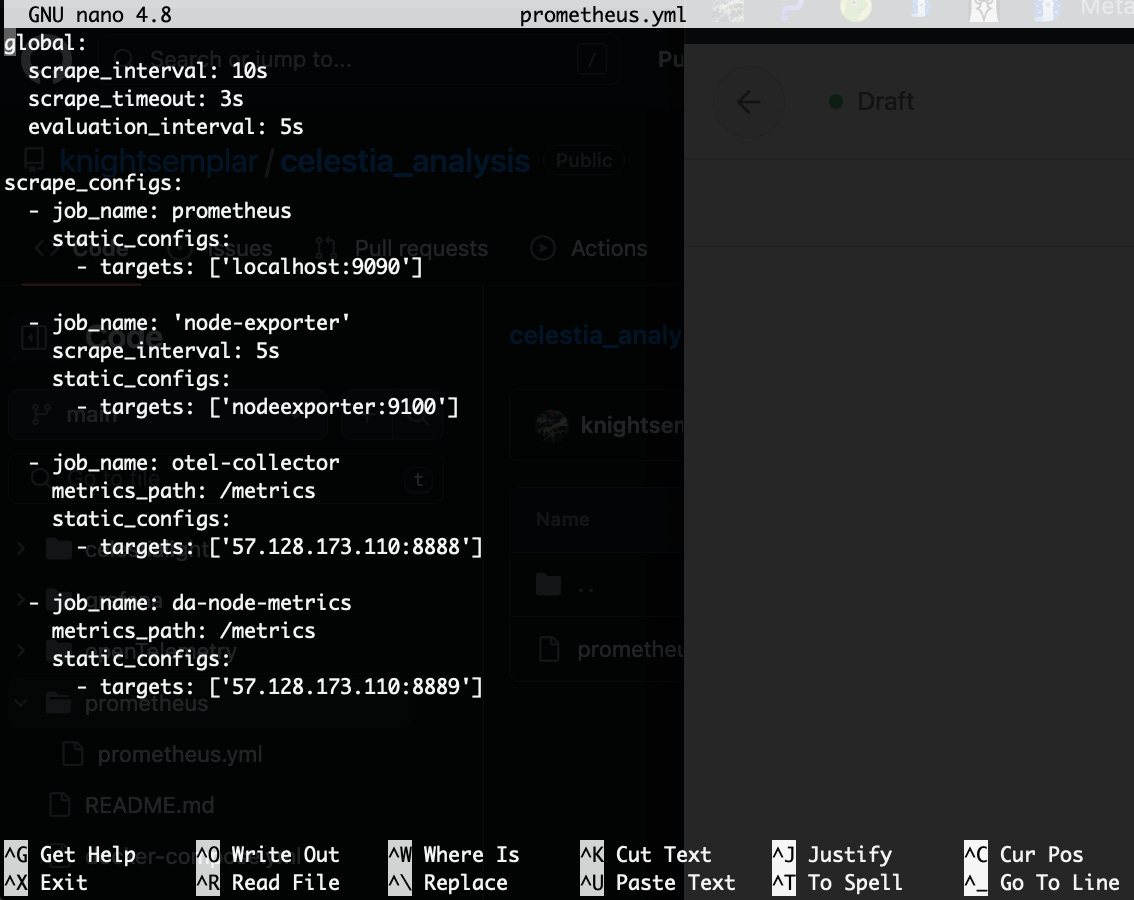
If you’re running ubuntu from any cloud provider then you will have a public IP. If running locally you have local host or an IP of 127.0.0.1. Provide that in the prometheus.yml file instead of the placeholder “Insert-Your-IP”
cd celestia_analysis && nano prometheus/prometheus.ymlWrite out, save and exit.
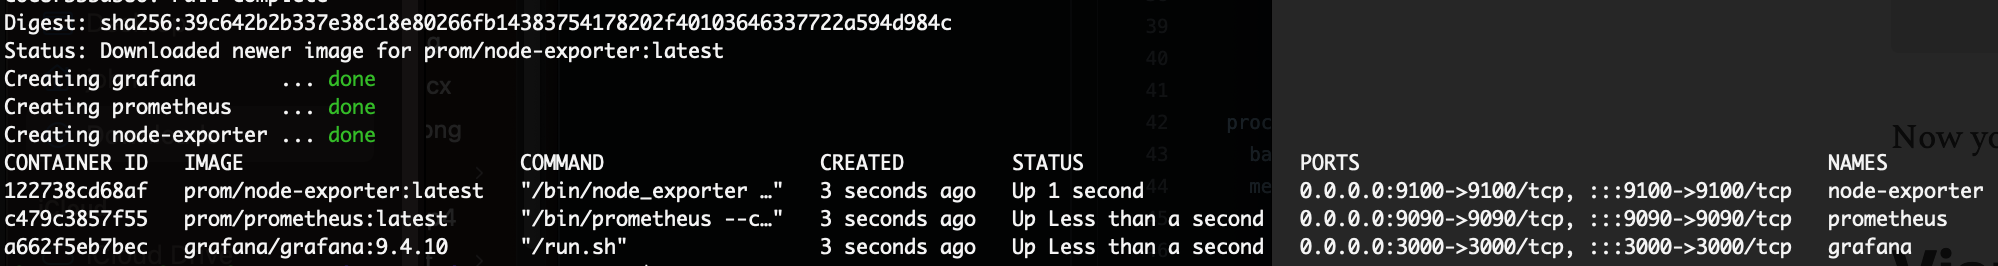
Now you have to run all of the necessary containers in docker. Run this command and check the running containers:
docker-compose up -d && docker ps
Now you will see all of the containers are running.
Visualisation From Grafana
To see the dashboard you need to open your browser and paste this url:
If you run in a cloud ubuntu server:
http://your-server-public-ip:3000
If you run in local:
http://localhost:3000
Credentials of Grafana
Username: admin
Password: admin
You will then be prompted to change password.
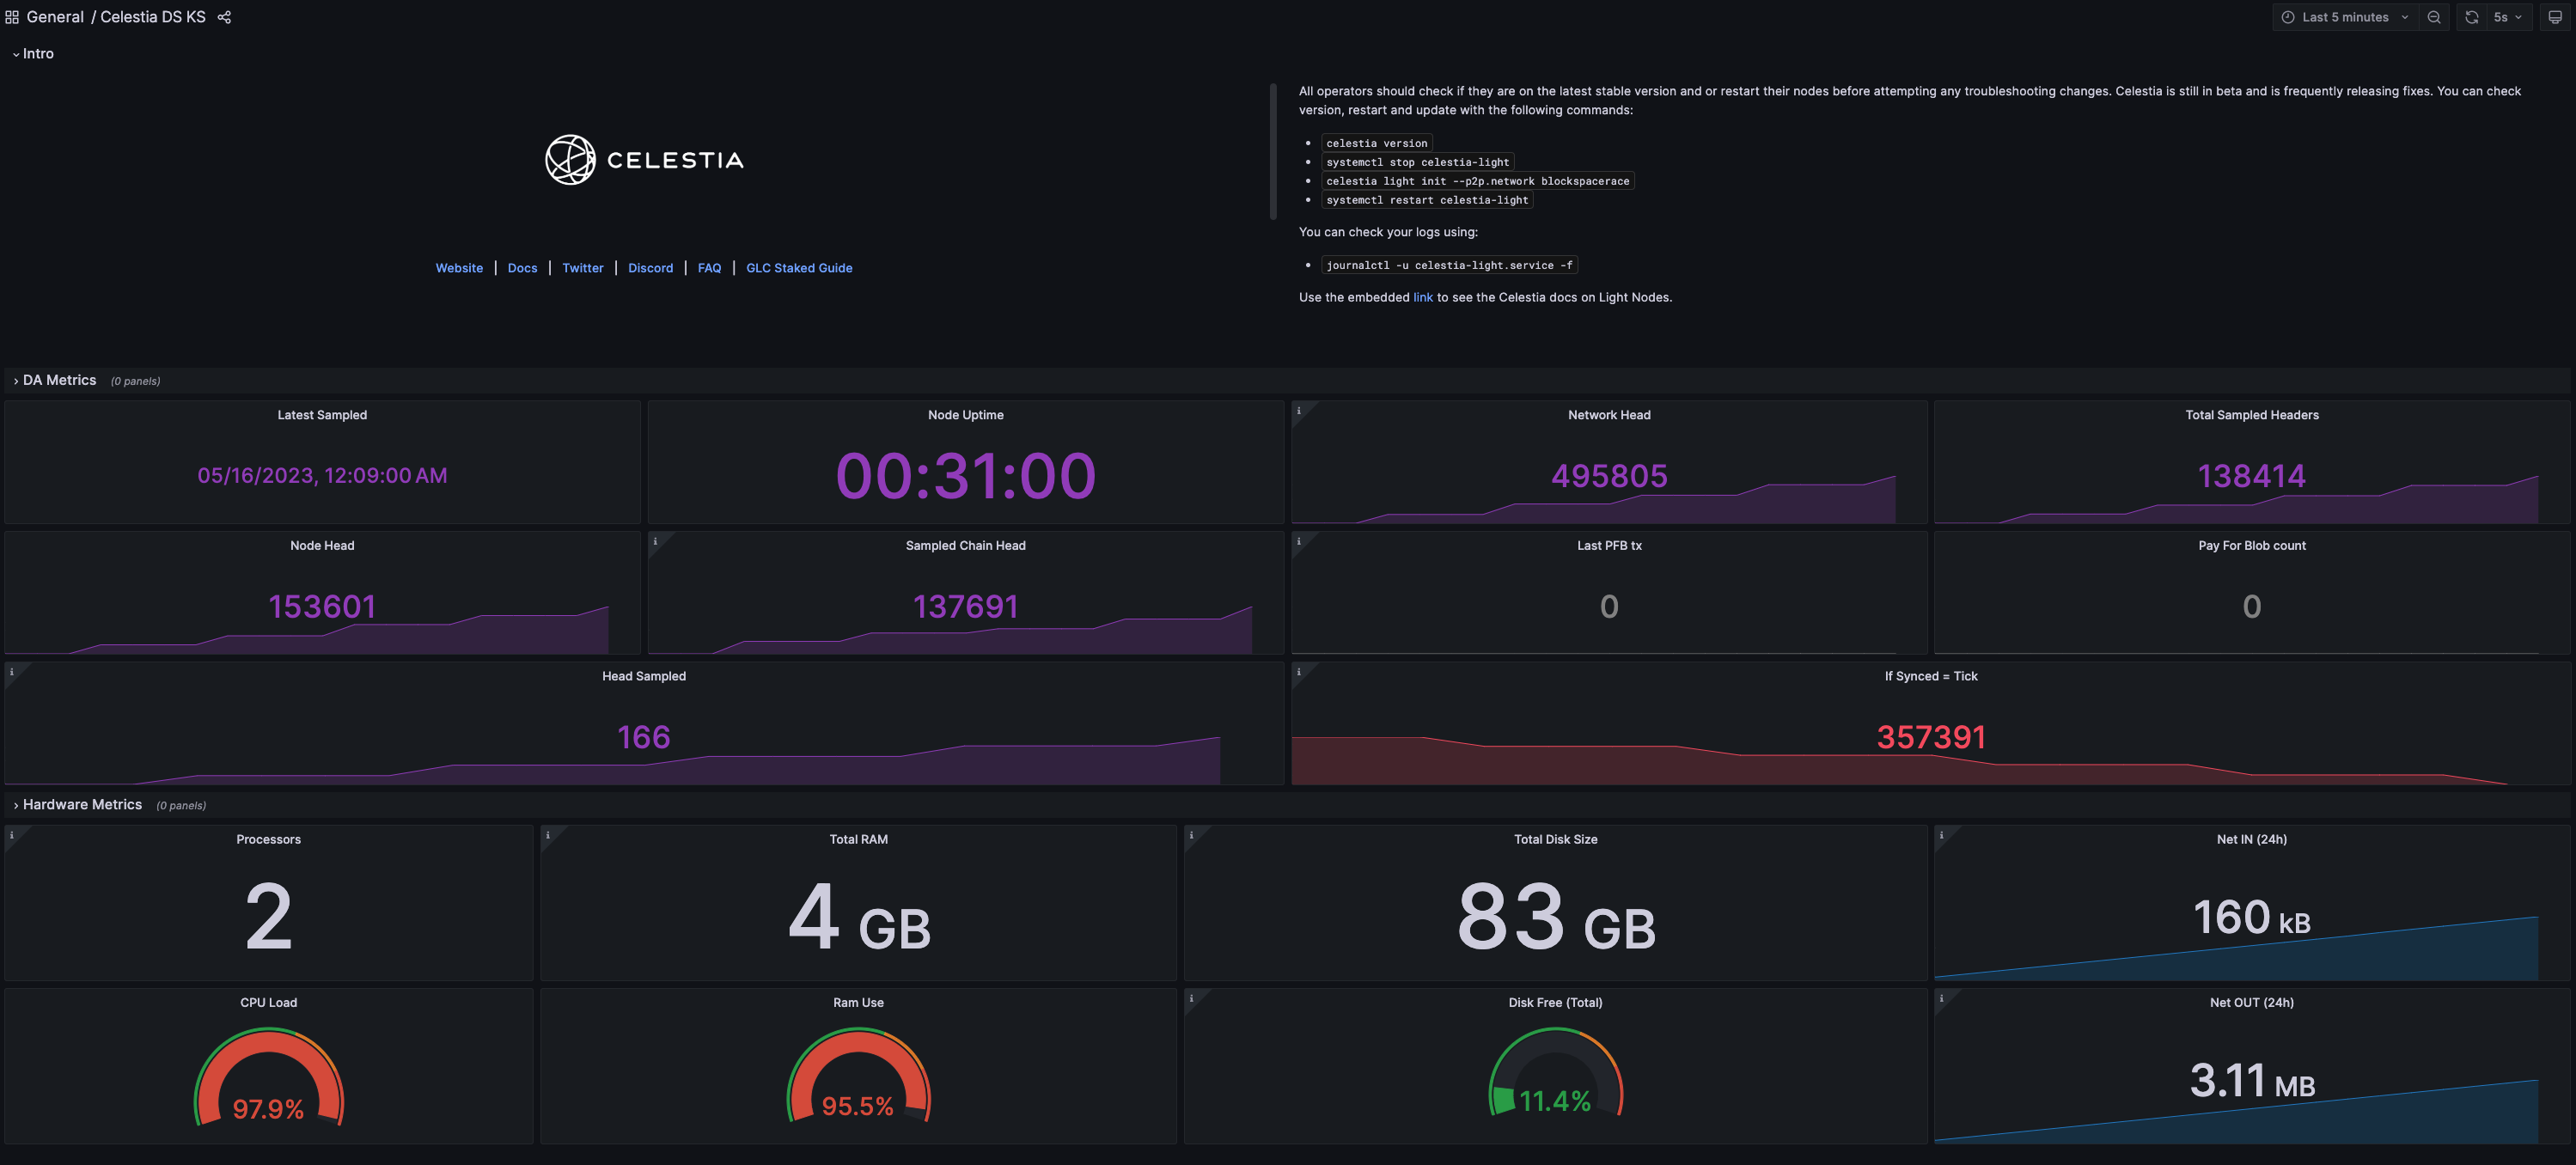
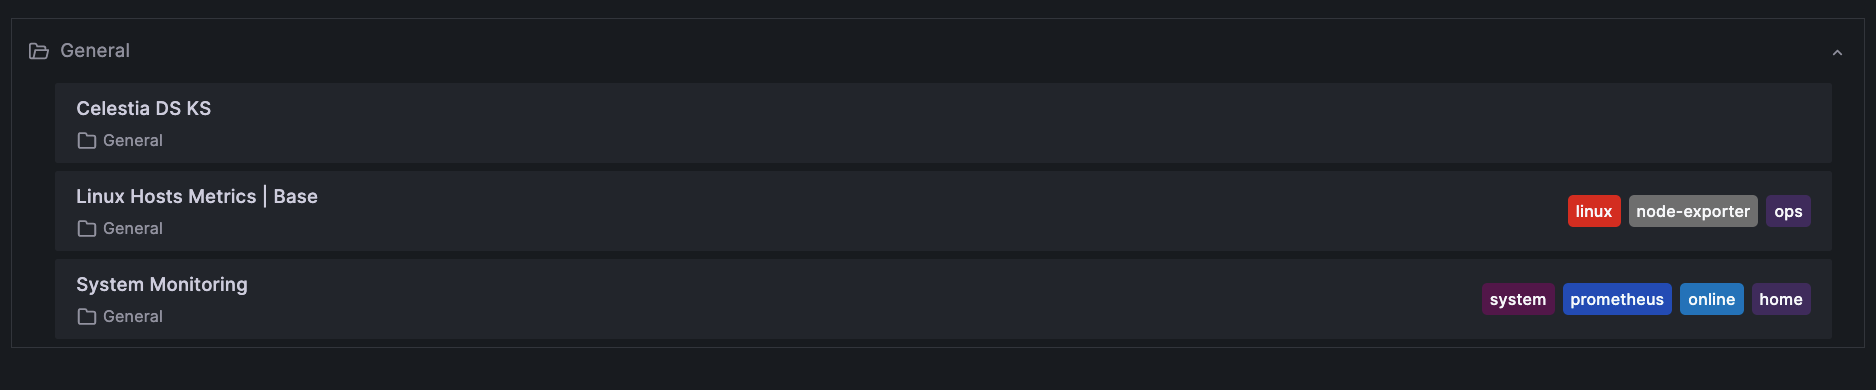
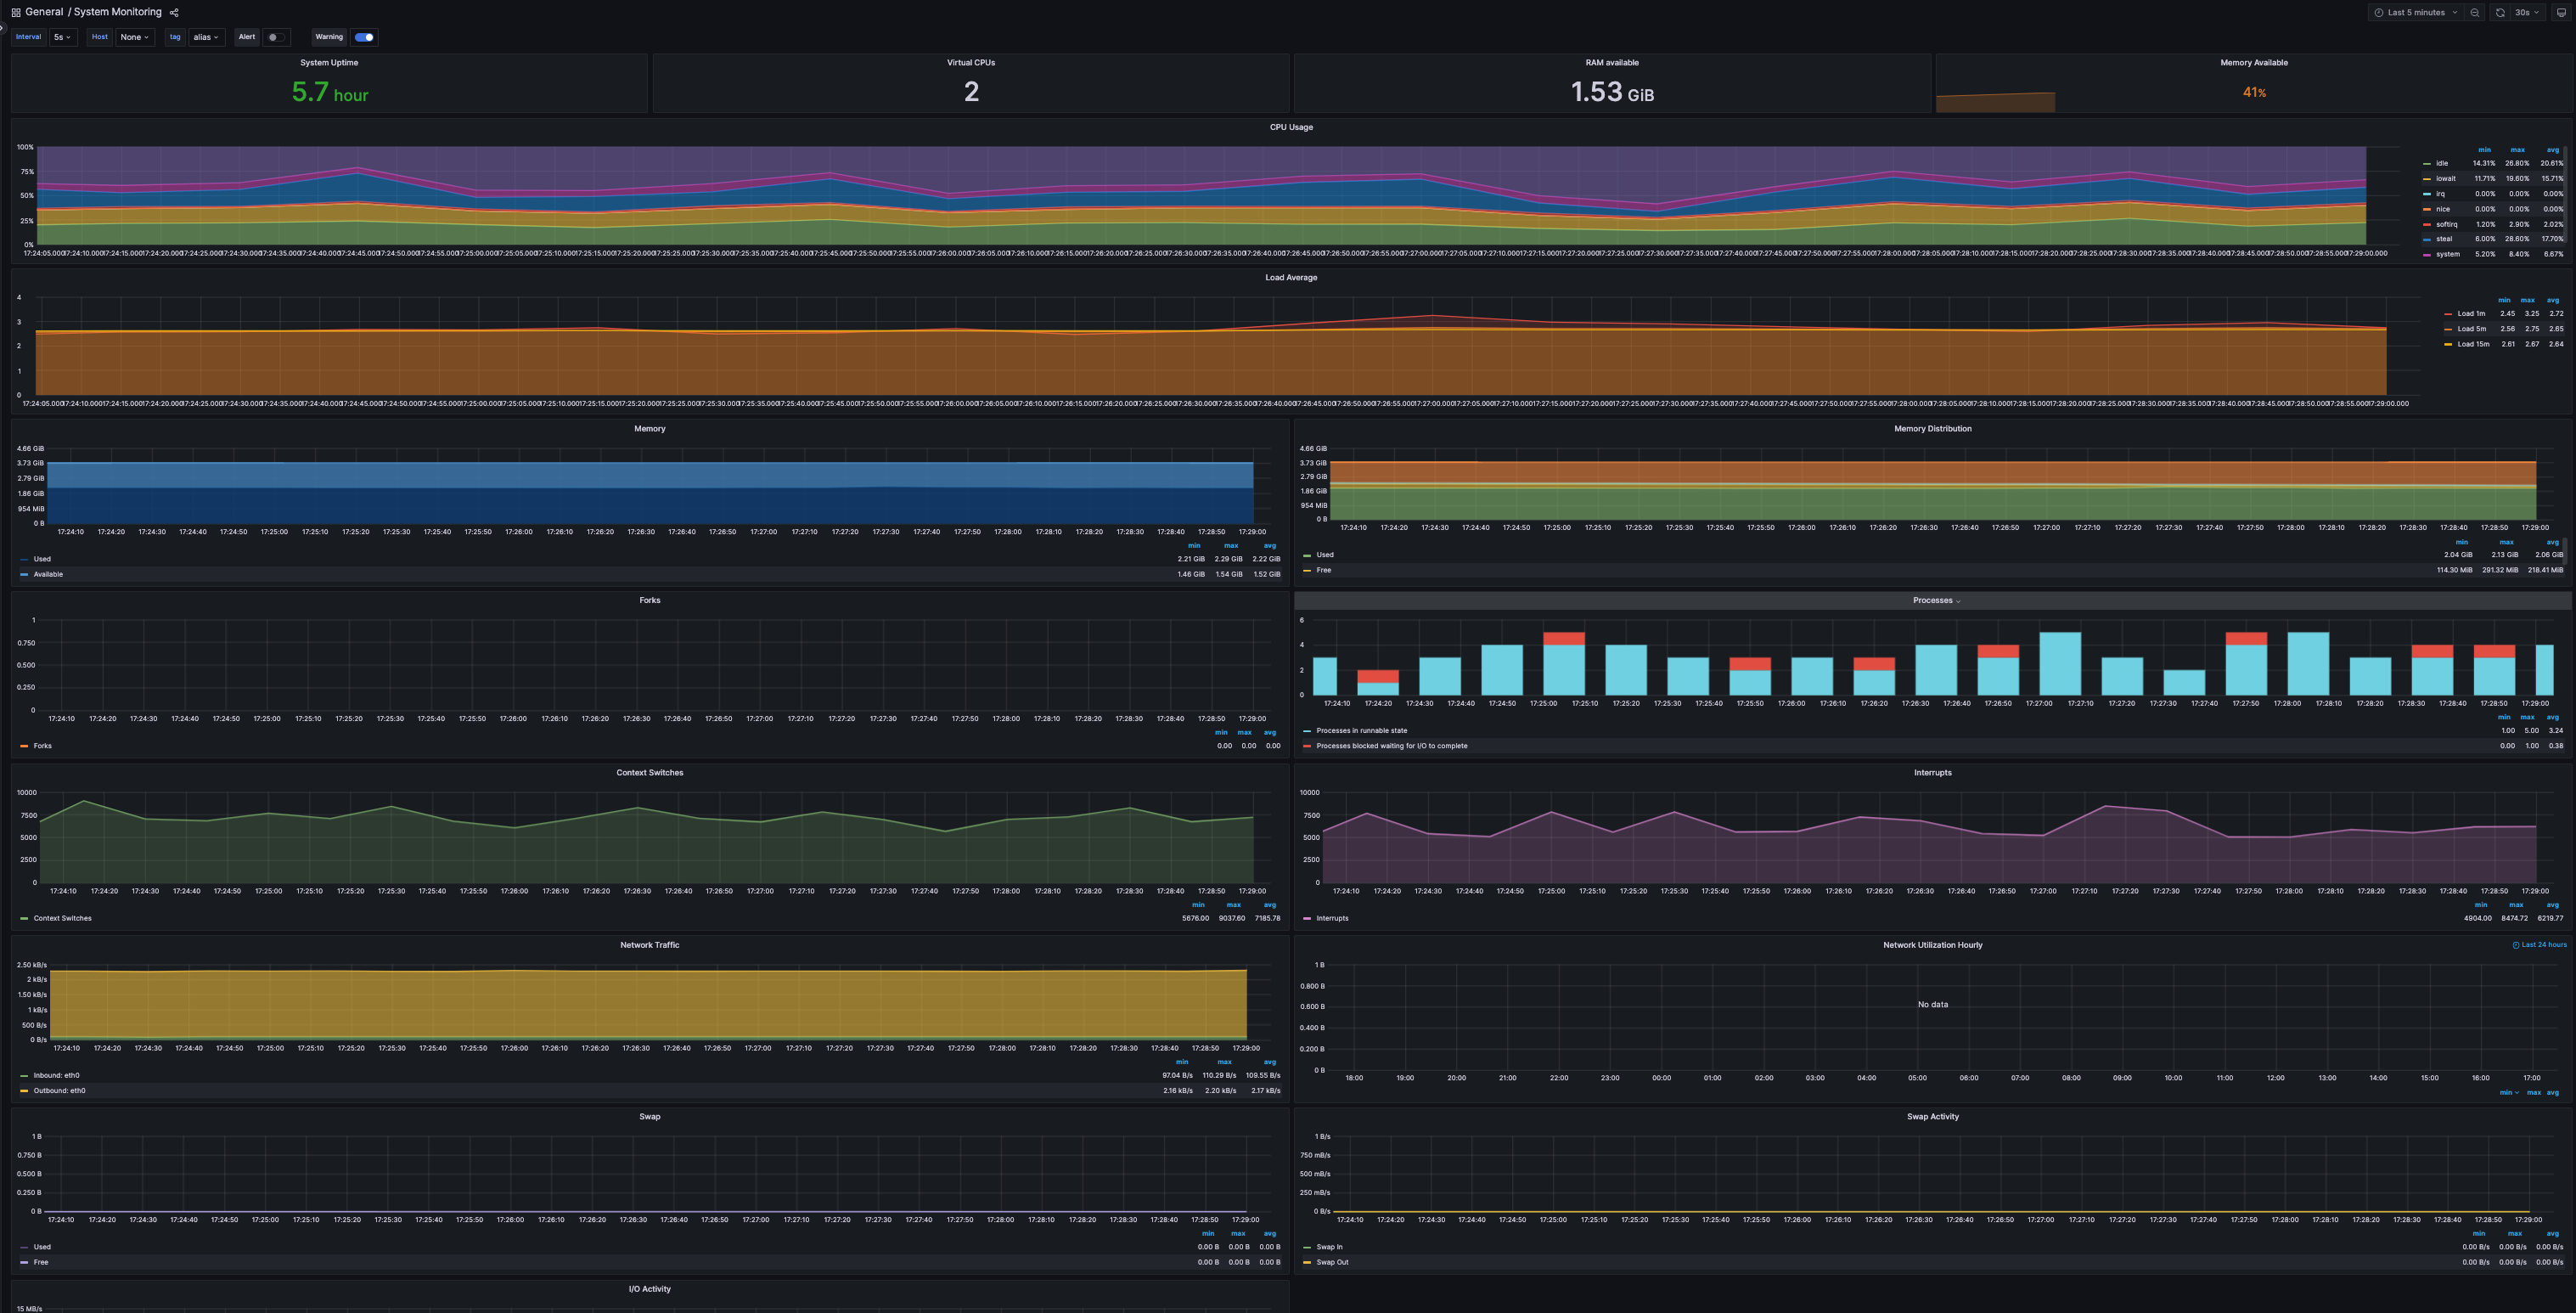
There will be three dashboards available to choose from, the first showing combined basic analysis. The second two offer more technical system analysis.
A simple mix of DA metrics and hardware metrics

Things to look out for:
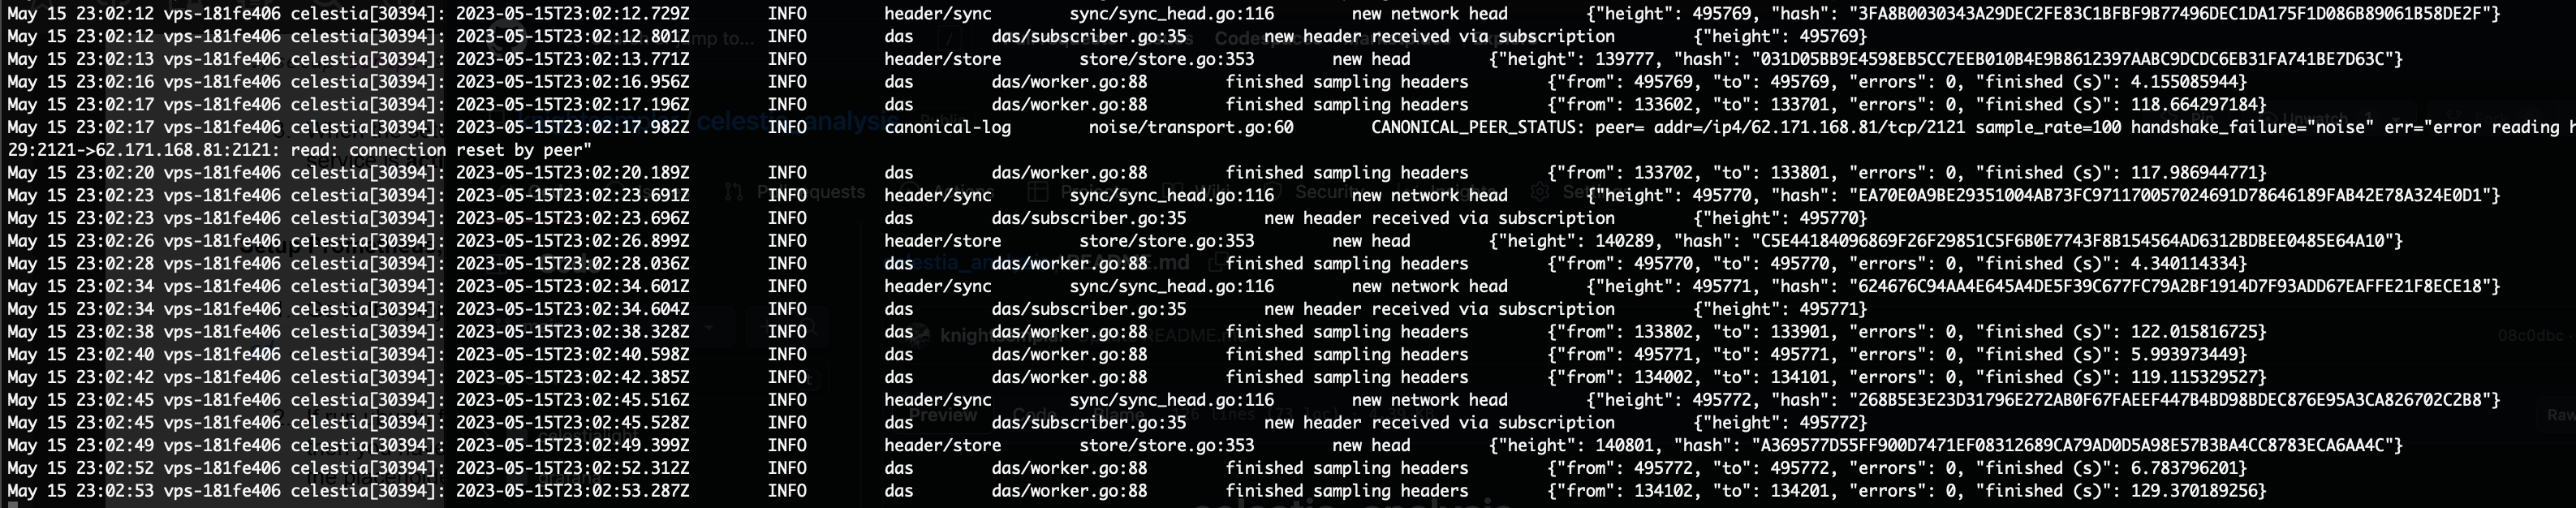
Even rate of sampled headers
Last sampled time was recent
Synced: Where the network head matches the Total Sampled Headers. This can take a while when initially setting up.
CPU load: if very high you might want to check logs. This will be higher when syncing.
RAM use: in this low spec system this will be high, don’t be alarmed.
Disk Free: if this is filling up you might need to restart to encourage pruning.
Net IN/OUT: consuming a lot of data indicates a problem.
Ultimately if you are having concerns it’s always best to check your logs to see what’s going on.
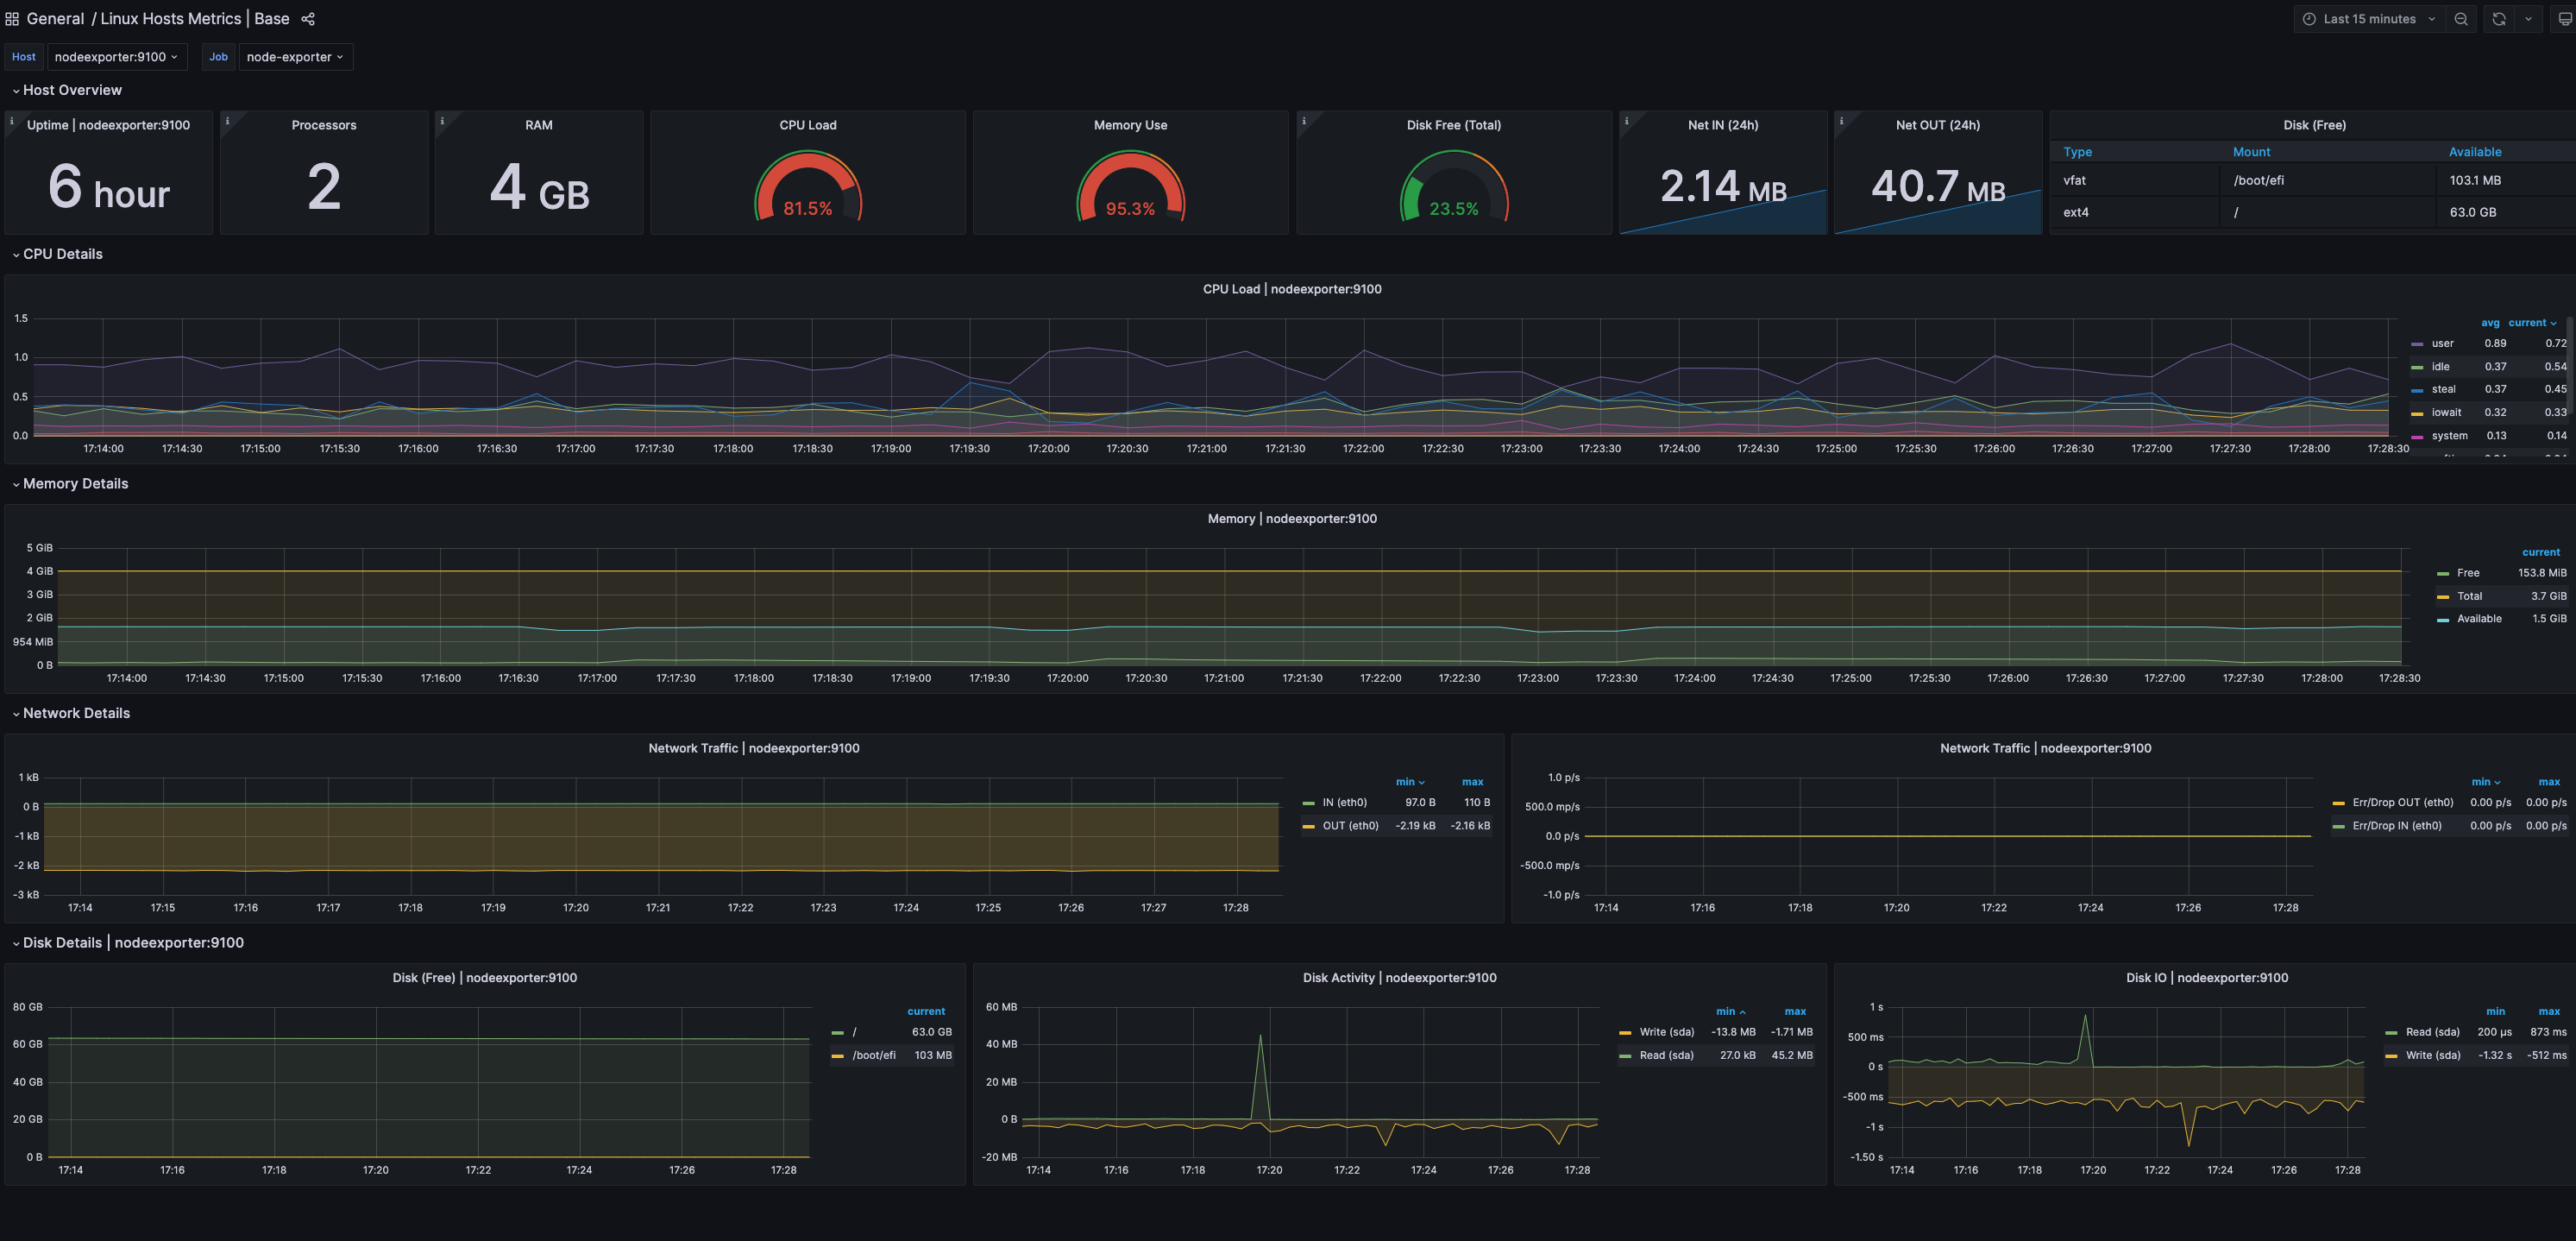
Further system monitoring here
Further metrics that are available if you want to build your own dashboard:

References
https://github.com/celestiaorg/celestia-node/blob/main/docs/adr/adr-010-incentivized-testnet-monitoring.md
https://github.com/GLCNI/celestia-node-scripts/tree/main/multi-network
https://github.com/P-OPSTeam/celestia-tools/tree/main/grafana